Simple chart
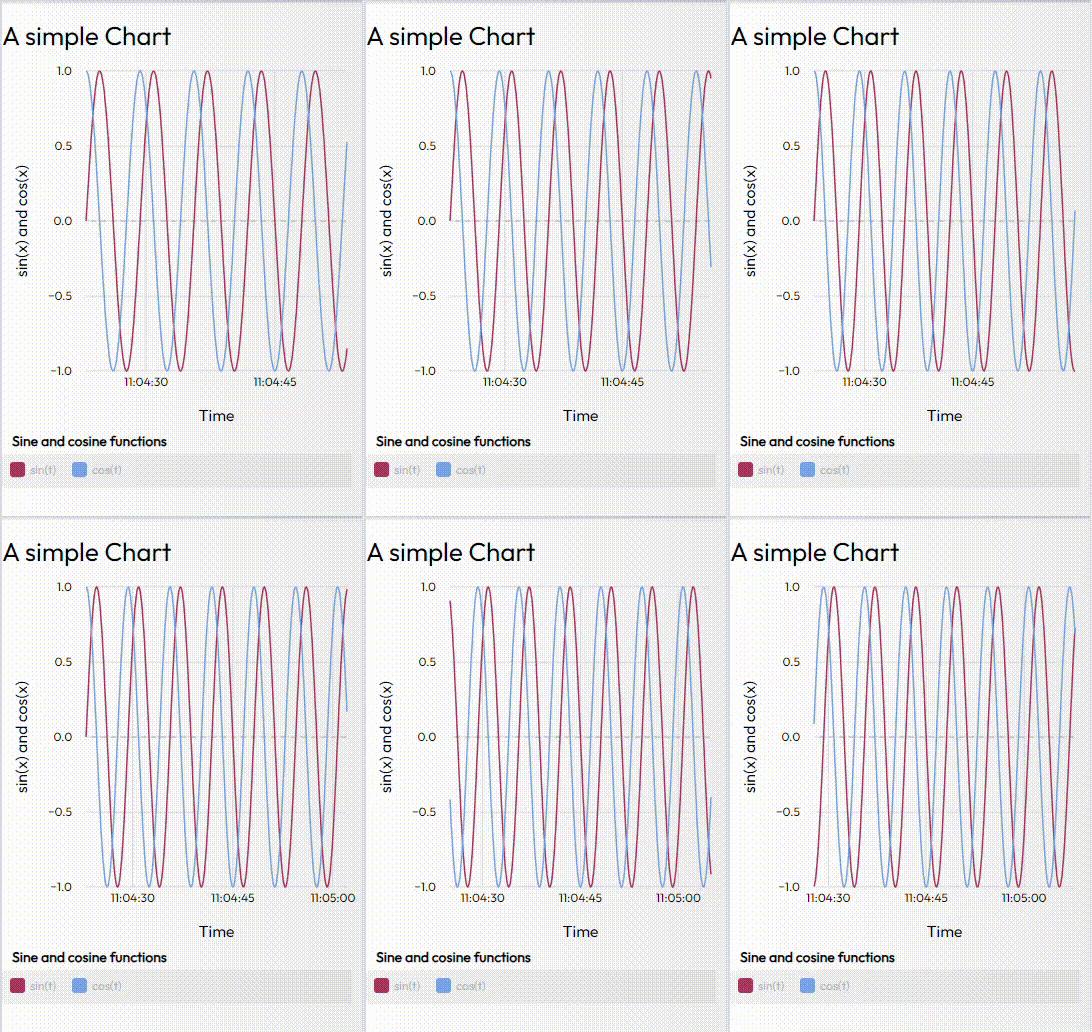
This example shows how to display a chart (here the sine and cosine functions).

Hardware
No hardware is needed for this example. You can run it without being logged in.
Dashboard components
The chart component offers many settings and several of them are used here: axis, labels, reference line...
Dataflow graph
The dataflow is quite simple. The 'ticker' node is used to generate parameters for the sine and cosine functions. The 'Multiserie chart data' serializes these results and prepares them to the chart graphical component. That's it.