RKit-Java
Installation
Debugging Java requires multiple tools installations:
- Ride-7 IDE is available on the Raisonance web site.
- At the top of Ride-7 you need to install the specific RKit-Java also available on the Raisonance web site.
- to compile your Java code, you need the javac compiler from Oracle. By default, we recommend to install OpenJDK 1.8
- IoTize Studio needs also to be installed to provide the IOT_JVM environment and classes.
Note that all these tools are available for free.
Contents
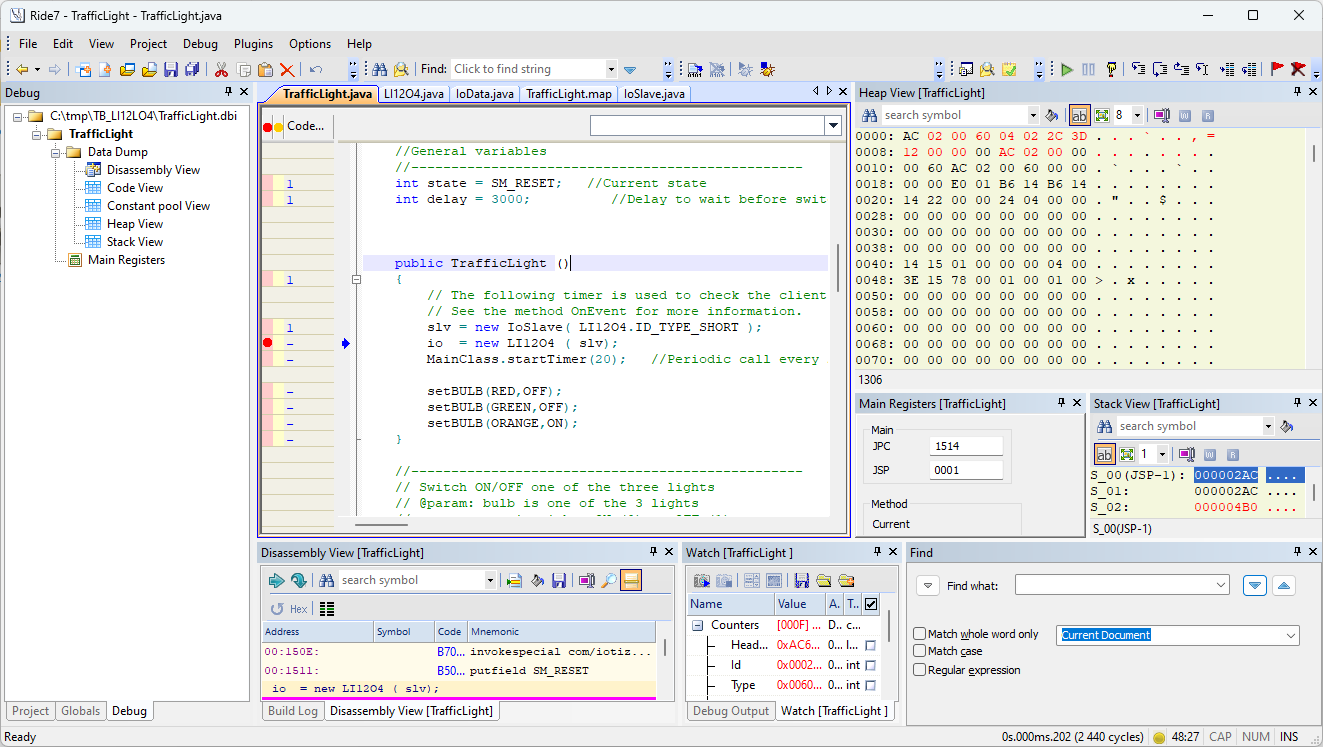
With RIDE-7, you will have a full-featured editor and the environment will allow you to compile directly your Java code. Then, two JVM are available for debugging:
- the simulator running on your computer (that is more or less the same JVM compiled for Windows),
- the debugger that needs a connected TapNLink.
Constraints
Various constraints exist:
- debugging at the assembly level is very difficult and we assume that you have the original Java source file.
- the size settings (size size, minimal code size,...) defined in RIDE must match with the configuration settings defined in Studio (and loaded into the Tap configuration memory).
- when debugging with the real time debugger, you must be logged as administrator. Credentials have to be entered in the debugger options.
When starting a debug session, the following actions will be performed:
- the Java program will be compiled and linked (if they are more recent than the bcb file),
- the CRC code will be checked. If both CRC match, the code will not be uploaded. If they differ, the code will be uploded in RAM (not in FLASH) only if the available space code is large enough.
We recommend to set the 'minimal code size' to a few kilobytes more than what you really need to be sure that you could debug without changing the whole configuration. Note that the code size cannot exceed 64 KB but depending on the overall configuration it could be much lower. The main processes that consume RAM and compete with the Java machine for RAM usage are the stacks for Wi-Fi, for Bluetooth and for TLS.
Sometimes, you may have to choose between Wi-Fi and Bluetooth if you need a large Java application. But you can also start/stop one or the other from the Java program in order to control the RAM consumption.
Differences between the simulator and the debugger
Debugging on the real TAP allow to access directly to the hardware resources (IOs, real variables,...). But very often, these variables can be forced manually in the simulator.
On the other hand, the simulator provides some extra features that are not available in the real time debugger, such as:
- code coverage,
- breakpoint on data access.
Because the JVM is pure software, executing on a PC is faster than on the real TAP.
Common features
Both the simulator and debugger allow you to:
-
set up up to 8 breakpoints on the byte code (either at the source level or at the assembler level),
-
display the assembly code,
-
display the contents of memory spaces: heap, stack, etc.
-
inspect classes and their different members,
-
get information about exceptions and memory usage.
Versions
The initial version (2020Q1) of the JVM had many limitations that have been fixed:
- it used to support only a single class,
- the memory management was almost 'static' (no more limitation but the overall RAM size reserved for the JVM),
- the JSON class was not debuggable.
Moreover, native methods are often added. Therefore, we strongly recommend to use a version greater than 2.0 for Duetware and if possible, the latest one.