WattTap
WattTap is a plug to be placed on the mains that measures energy consumption.
This example consists in a complete application that has the following functions:
-
View current consumption data (power, voltage, current, phase,...)
-
View consumption history (last minutes, hours, days,...),
-
Manage an energy meter over a short period of time: start, pause, stop,...
-
Configure: price per kWh, modification of the factory calibration, etc.
Hardware
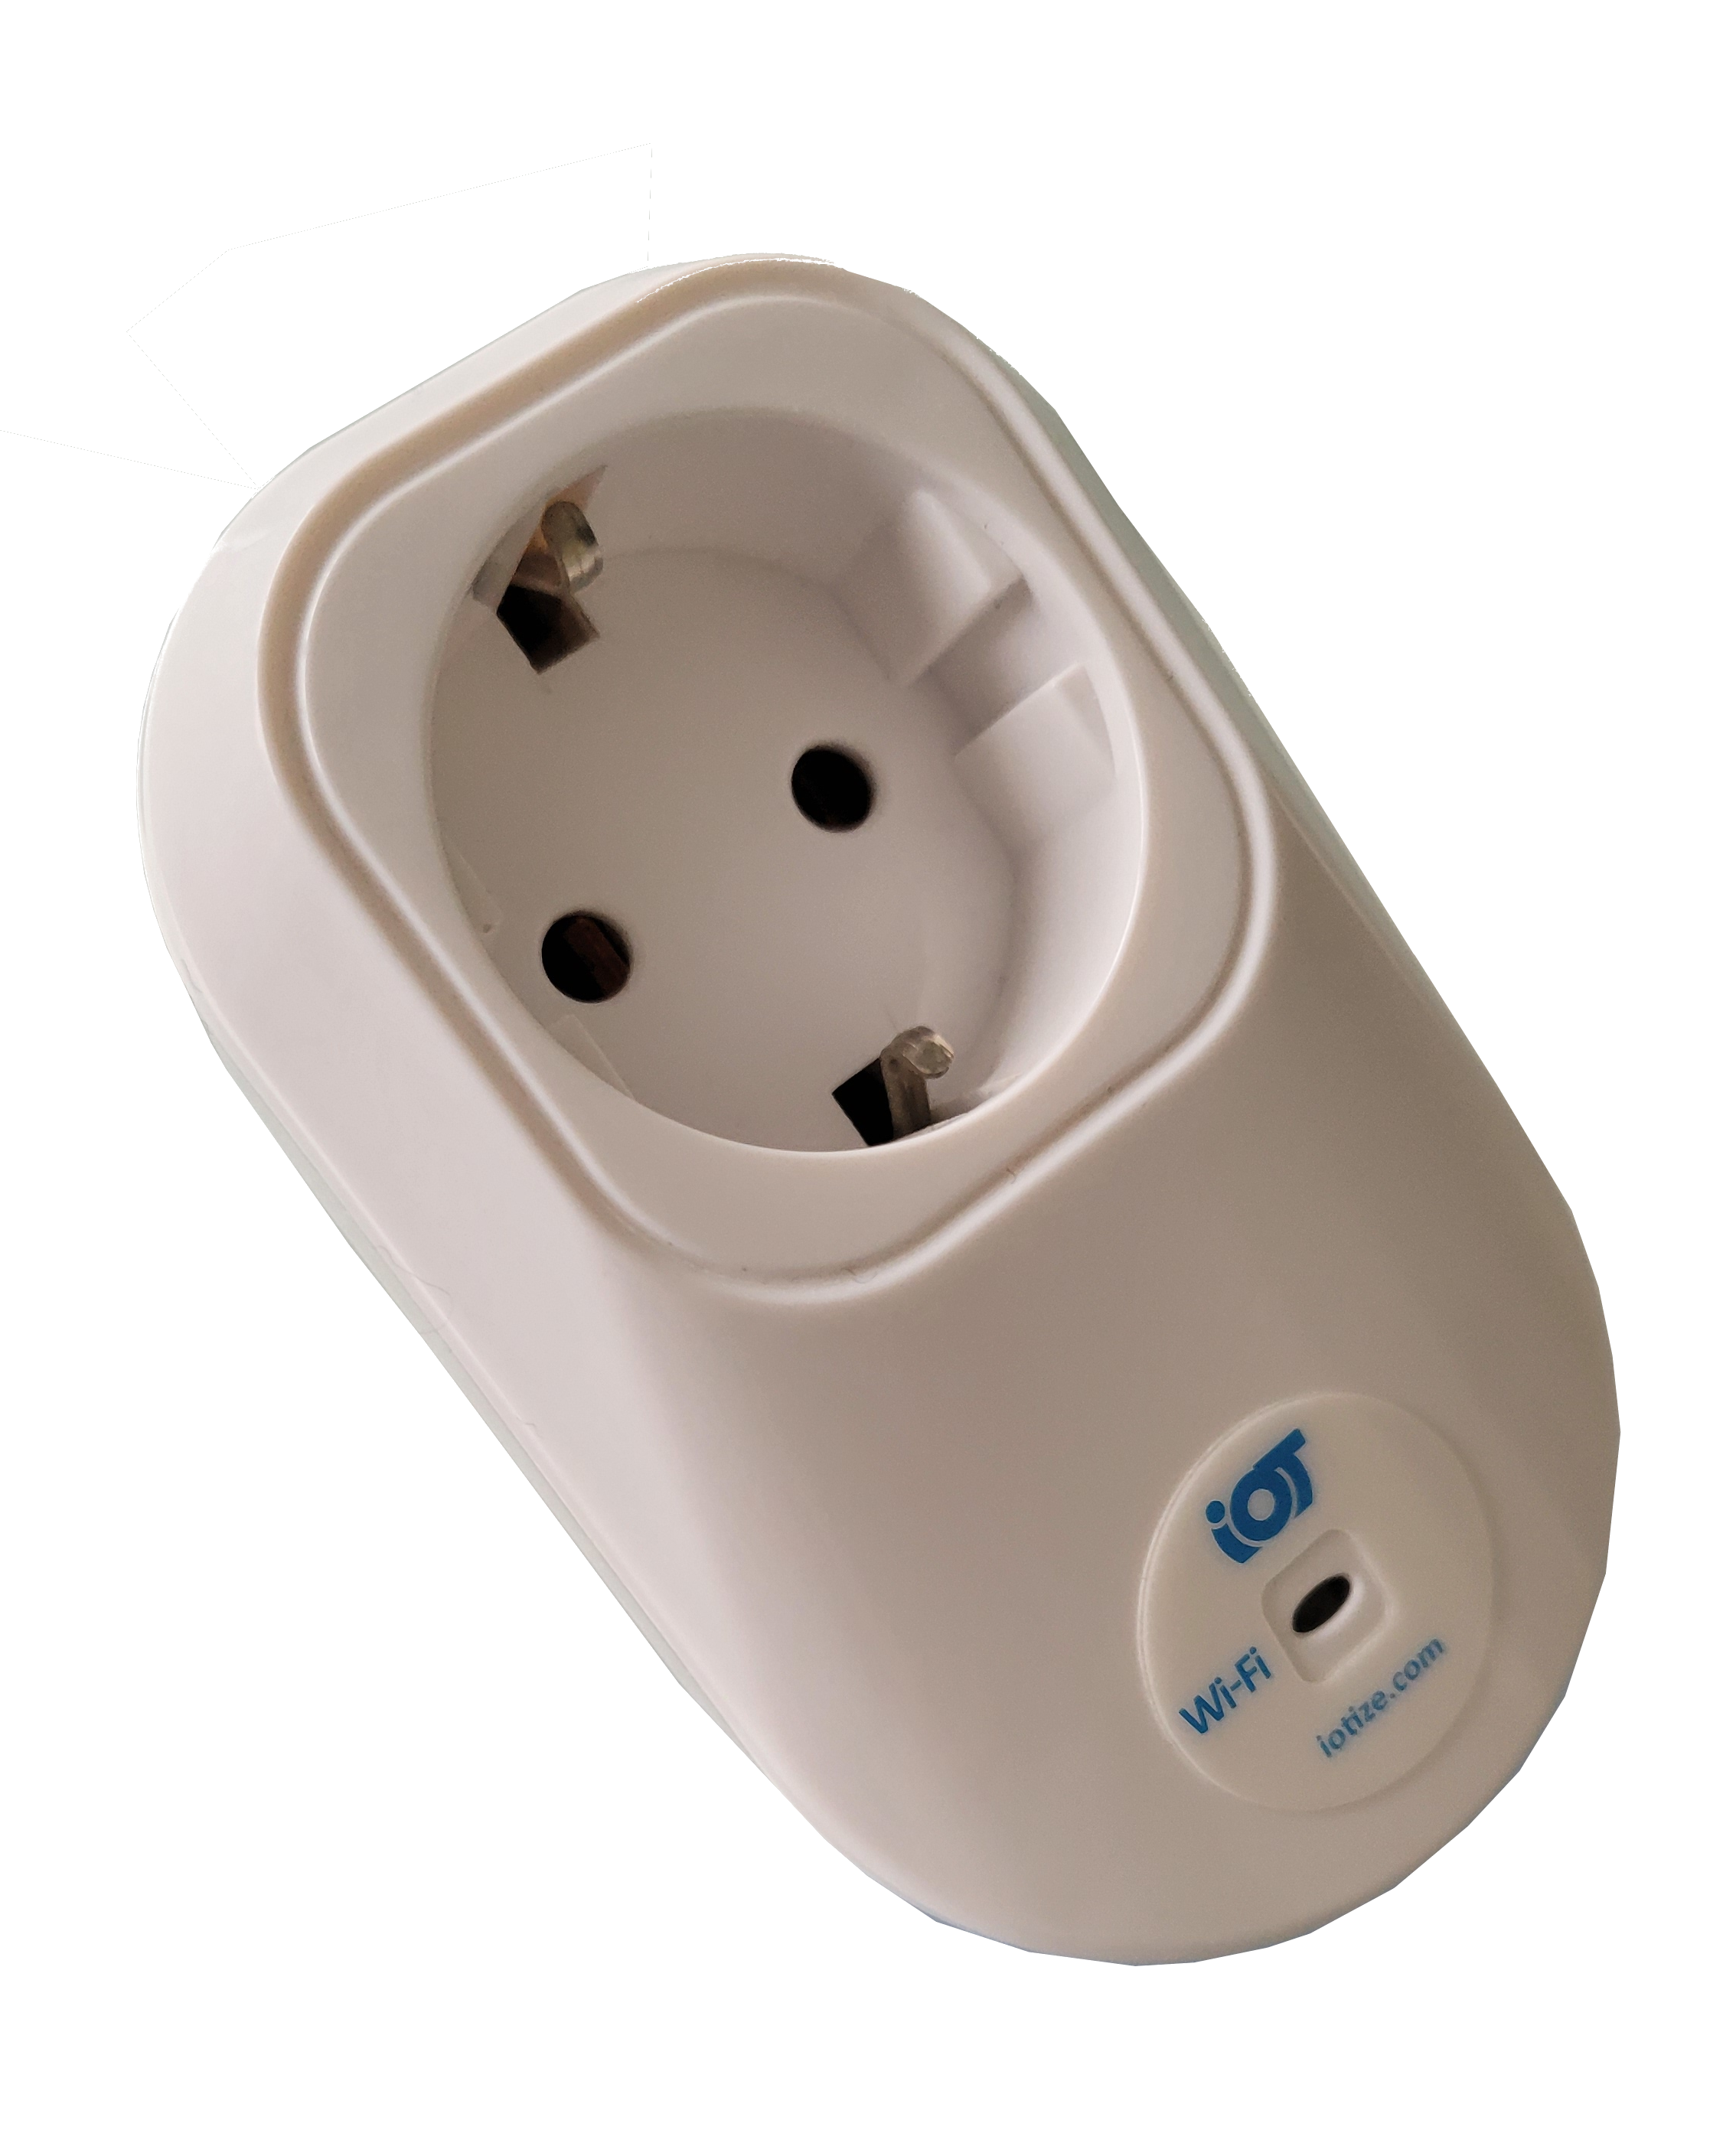
The energy sensor is based around the STPM32 component connected by SPI to an NFC/BLE/Wi-Fi TapNLink module. Current measurement is performed using a 10 mOhm resistor. The main data read are:
-
Voltage
-
Current
-
Phase
-
Frequency
-
Power
-
Energy
Energy history is stored on calendar pariods (last 15 minutes, last 24 hours, etc.).
UI components
A Tabs is used as header and main menu. Many different layout components are used (and somtimes nested) to organize the components: cards, vertical, horizontal, ion-item, ...
Bar charts allow to display the history of the energy consumption. Line chart displays the instant power.
Dataflow graph
The graph is quite complex because most of the components are hidden when the connection to the hardware is not established.
Preparing the data for display in the bar chart or line chart also requires several dedicated nodes.
login is managed thru a login dialog box.