Manuals/Dashboard Creator
Dashboard Creator by IoTize
This page is a general introduction of the Dashboard Creator. Additional information is provided in:
-
the UI Editor,
-
the Data Flow Editor,
-
the Getting Started tutorial that will help you discover the tool and create your own project.
Dashboard Creator: To Do What?
IoTize's no-code solution allows you to generate mobile apps to control any electronic system. The Dashboard Creator is the graphical environment where you design your custom user interfaces for your electronic systems.
The generated applications can operate in one of the following modes:
-
Static: a dedicated app is generated after transmission of the description from the Dashboard Creator to the App Creator environment. This will produce a project which you build into the final app (iOS, Android or web app).
-
Dynamic: a generic app loads the description of your user interface and builds the GUI from this description. A dynamic app can be used for a large number of devices. Note that the Preview mode in the UI Editor works in a similar way to a dynamic app.
Example
The video below shows a simple user interface for the TapNLink Primer based on the Sensor Demo project:
-
The app shown here is working in dynamic mode, loaded by our Tap Manager app which is installed on an Android mobile. You can also test this app yourself after configuring your TapNLink Primer evaluation kit to launch it.
-
Most graphical components are standard elements from the ionic libraries. The representation of curves is part of the open-source ngx-charts library.
-
The "Scheduler" is an HTML+JavaScript element built by IoTize and added as a plugin using the Dashboard Creator APIs. This Scheduler is a graphical control for programming a time schedule. It can easily be associated with a variable on a TapNLink or on a target board. However, this association wasn't done as the variable does not exist in the firmware of the Blue Pill that is provided in the TapNLink Primer. This is an example of how you can build your own graphic components when you have special needs.
-
This user interface is built in the UI Editor. However, for a few advanced features such as objects that change colors according to particular states, the conditions and color changes have been defined with the Data Flow Editor.
Apart from building the Scheduler plugin, the entire application was made in a no-code mode.
Composition of the Dashboard Creator
The Dashboard Creator allows:
-
The import of variables from a dictionary file. If you are working with an IoTize product (TapNLink, Tapioca, TapNPass, etc.) the easiest way is to directly import the IOTZ configuration file that you created in IoTize Studio. You can also import an ELF file (executable with information about variables, types, etc.) when working with a microcontroller. For systems with a fieldbus (Modbus or CAN), you can create and import a CSV file (or DBC file for CAN) that lists the accessible registers.
-
The linking of these variables or registers to graphical components (text fields, gauges, sliders, charts, etc.) that can be configured individually.
-
The organization of graphic components using layout components (tabs, grids, cards, etc.) which can themselves be nested.
-
The optional management of data flows, for example to calculate an arithmetic expression between two values in order to display their sum, or quotient.
-
The optional addition of custom widgets or images. It is also possible to add your own plugins that are based on HTML, JavaScript and CSS.
To do all of this, the Dashboard Creator provides two complementary tools:
-
The UI Editor which provides access to all of these functions, except for data flow management.
-
The Data Flow Editor which allows the importation, transformation and reprojection of data to the UI Editor.
The diagram below shows the general workflow for these tools when you are generating a static app:
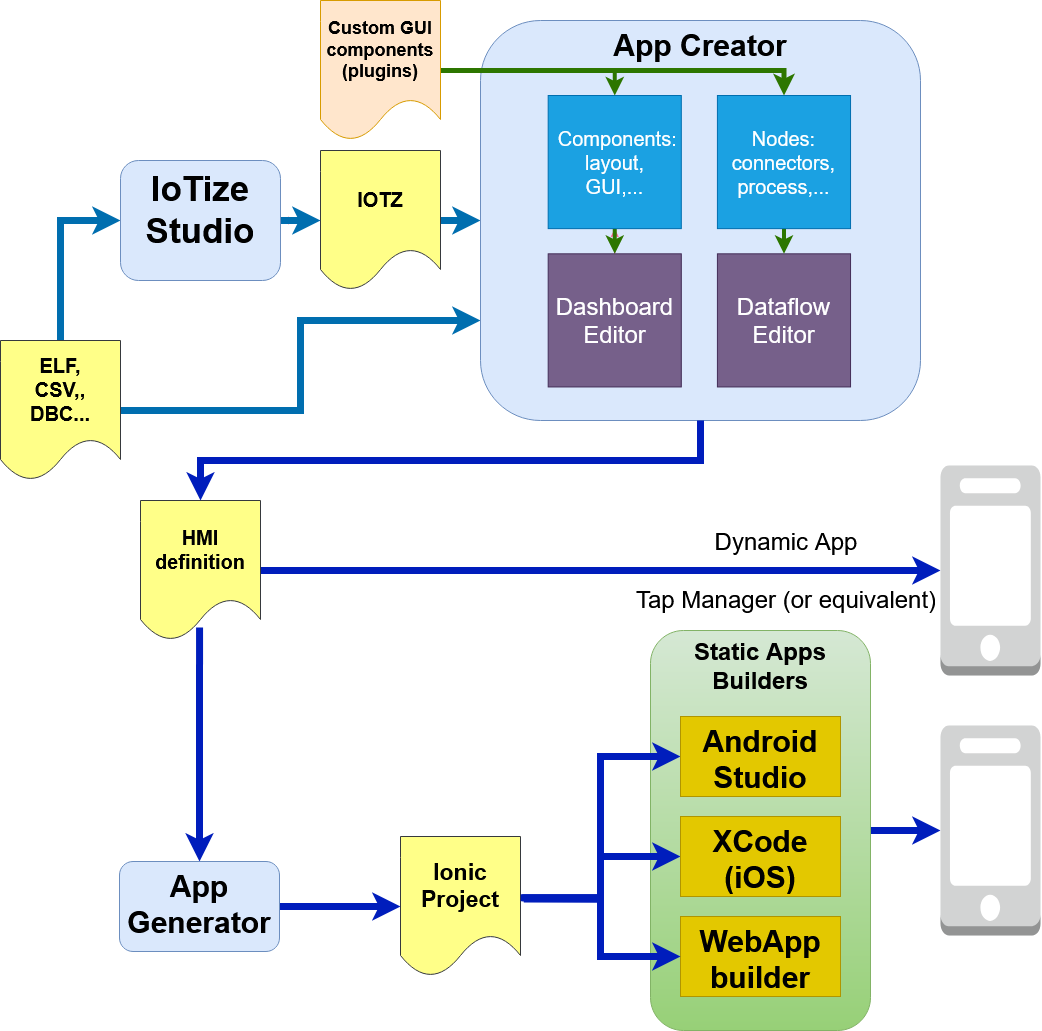
In the diagram above, we see that it is possible to go through IoTize Studio, or to bypass this step and define the variables directly from a file in ELF, CSV, or other format. We strongly recommend that you go through IoTize Studio and load an IOTZ file (except for a first quick PoC). You will thus benefit from the management of access rights to variables, and more generally from a secure environment.
For a dynamic app, it is no longer necessary to go through App Generator. However, you do need a skeleton app that works like Tap Manager. Contact IoTize if you want to do this.
For many simple applications, only the UI Editor is necessary and useful. On the other hand, working with the Data Flow Editor may be necessary as soon as you want to make variables interact with each other. For example, in our Sensor Demo project, the Data Flow Editor was used in three special cases:
-
To calculate a percentage: (count/count_max)*100. In this case, two values interact.
-
To change the color of the graphic component according to the value of this percentage (green < 70%, orange when higher than 70%, red when higher than 90%). The algorithm to select the color is not implemented in the embedded system, but in the app.
-
To change the text and the color of the component presenting the status of the LED (green for On, white for Off).
The Data Flow Editor provides flexibility when more complexity is needed in the user interface, however it remains a simple, easy-to-use graphical tool.
Get Started with the Dashboard Creator
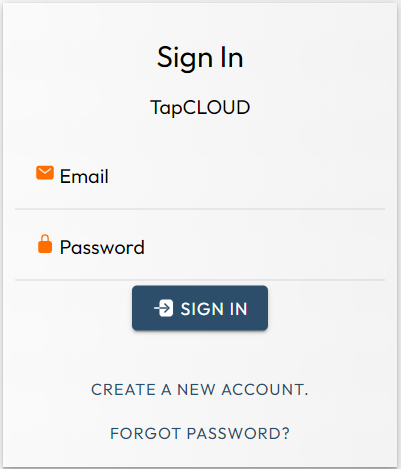
The Dashboard Creator is available as a web app via TapCLOUD:
Create your TapCLOUD user account
If you do not have a TapCLOUD user account, you will need to create one first:
The Home Page
Once your account is created, you will have access to the Tap Manager app in web app mode. It allows you to:
-
Create and manage workspaces. You can invite colleagues to these workspaces to share projects. Within these workspaces, you can create your mobile apps.
-
Register and manage your IoTize wireless products (TapNLink, Tapioca, TapNPass, etc.). You will also be able to update the firmware of your equipment.
-
Test virtual demos (Live Demo).
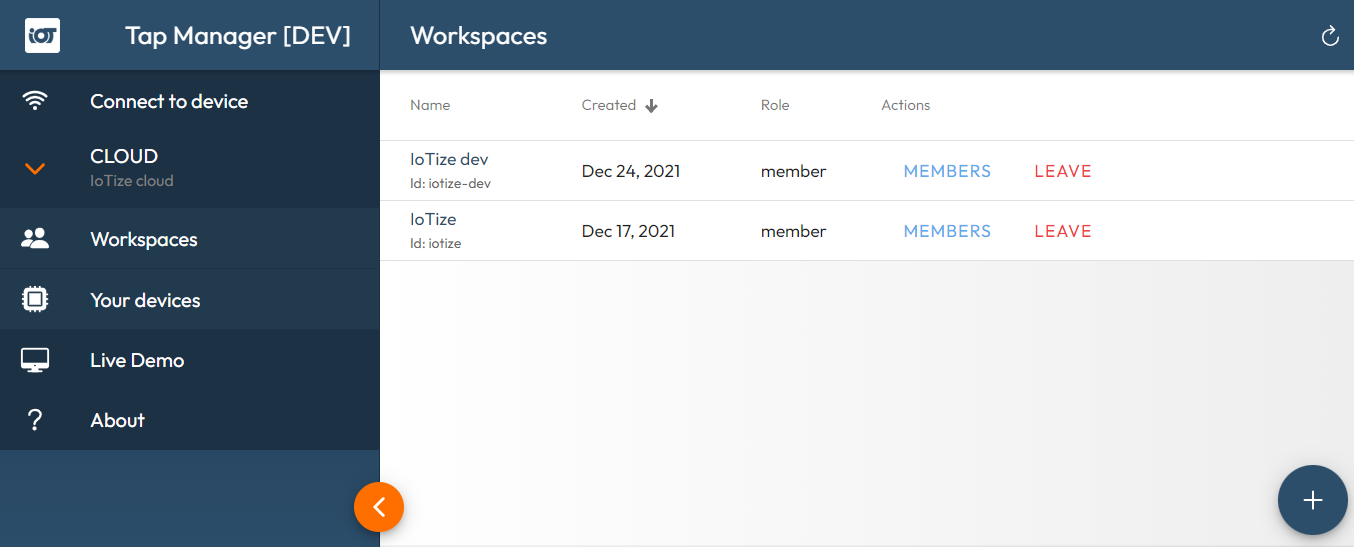
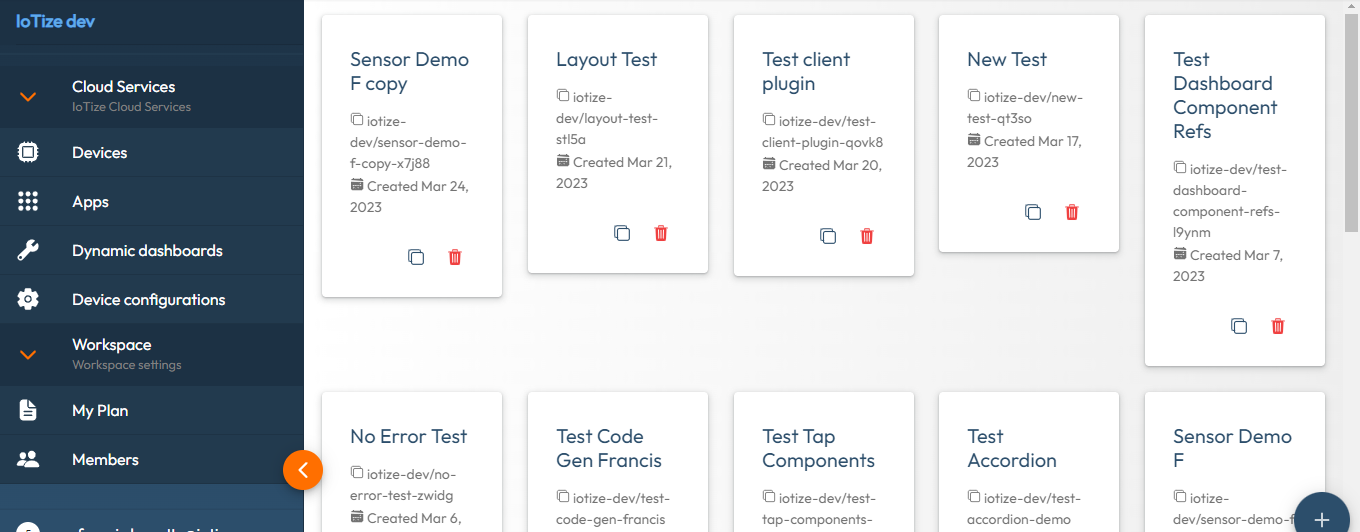
Workspaces
Click on Workspaces. You will find a first Example workspace that has been created for you. You can explore this Example. To open an existing workspace, just click on the link in the Id or Name columns. Once the workspace is open you have access to:
-
Devices: a list of IoTize wireless devices associated with the workspace.
-
Apps: a list of projects for generating apps,
-
Dynamic dashboards: a list of dashboards that are editable. These dashboards can be moved to the Apps section later.
-
Device configurations: a list of wireless device configurations,
-
Members: the list of members of the current workspace.
Note that to create your own workspace, press the (+) button in the bottom right corner of the window.
In what follows, we will focus on Dynamic dashboards, which is composed of the UI Editor and the Data Flow Editor.
Click on Dynamic dashboards. Now, either click to open an existing project, or click on the (+) button in the bottom right corner of the window to create a new project:
If you decide to create your own new project, follow this tutorial first.
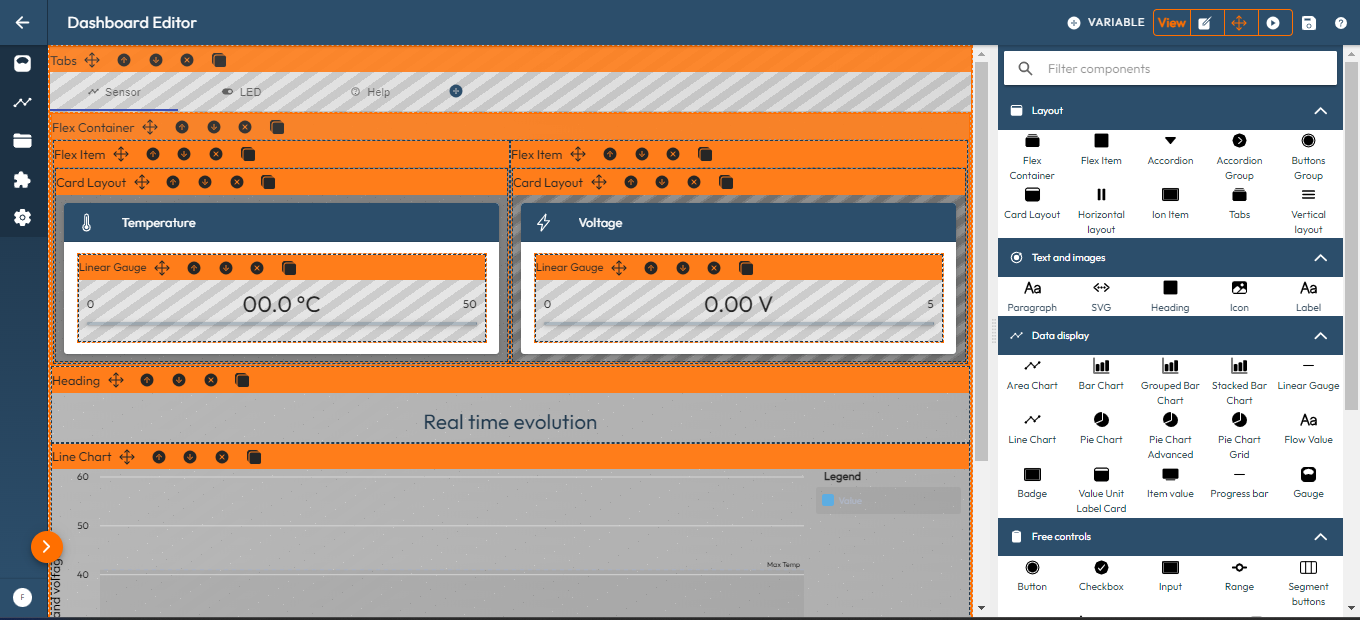
The UI Editor
This consists of two main parts:
-
The left side which represents by zone the user interface and the included graphical displays and controls.
-
The right side which presents the available graphical components. When a component is selected in the layout on the left side, the right side displays the configurable settings for that component.
Four buttons at the top right corner allow you to:
-
Add variables from the resource files that are already declared,
-
Switch between the Component Edition and Place/Move views for the graphical interface,
-
Switch to the Preview to see and test the graphical interface,
-
Save the current project on the server,
-
Open the help.
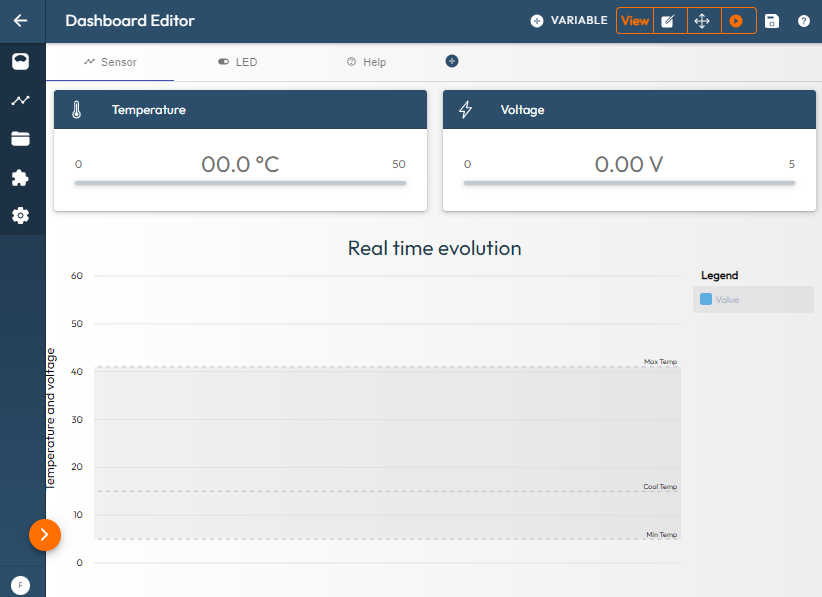
If you open the sample Sensor Demo project, you will see the following screen:
Click on the Preview button to hide the graphic components panel and view a rendering of the graphical interface for the app:
Graphical Components
The two main types of graphical components are:
-
Layout components: these contain other components in the interface for display or layout control. They allow you to create the structures of the pages of your mobile app.
-
Display components: these will allow you to display (read) or change (write) values in text or graphic form (field, chart, gauge, etc.). Display components are generally placed inside layout components, but nothing prohibits you from placing a display component outside of layout components.
To add a component to the Component Edition view:
-
Click on the Add Content button in the page. A list opens with components that you can select,
-
Or select a component on the right, and drag and drop it on an Add Content button.
More detailed information about UI Editor graphical components is provided here.
The Data Flow Editor
To Do What?
First, remember that editing the data flow is not mandatory. It is necessary when you want to change settings or values in the app based on other settings or values.
For example, to give the choice to display a temperature in °C or in °F, it is likely that the physical sensor provides a single value in °C that you need to convert into °F in the app. If this is not done at the component level, you can easily do this in the Data Flow Editor.
The General Principles
The data flow is composed of nodes and their connections. The connections have a transmitter at one end (the right side of a node), and a receiver at the other end.
Communication along these connections is best viewed as event signals rather than real data streams. We use the term data flow, but it is more appropriate to speak of a network of signals where each signal can optionally be accompanied by a value or an object. This signal is generally emitted during a change in value, to signify to the receiving nodes that the value has changed. The nodes themselves have five different functions:
-
They can process input values. The Addition node, for example, will be activated when one of these two inputs is modified, and it will propogate tp the next receiver nodes (to its right) by providing them with the result of the new sum.
-
The Value exporter node only propagates the input value into the stream. On the other hand, it provides an interface point to export this value to the dashboard.
-
The Ticker node does not receive any connection, but it will emit periodic signals (without associating any value).
-
The GUI Component nodes are leaf nodes which receive notification of changes in the values to be displayed.
-
The nodes linked to a Tap (ie. TapNLink, Tapioca, TapNPass, etc.) will communicate with the Tap to read or write external variables, or perform actions such as a login.
So, there are many possible behaviors for these nodes. It should be remembered that, above all, this graphic makes it possible to create connections so that the different nodes are synchronized.
More detailed information about the nodes and the Data Flow Editor is provided here.
Porting the Result to a Mobile App
After your user interface for your app has been designed, you can test it as a dynamic app with Tap Manager or generate an app for Android and/or iOS.
Access from a Dynamic App
Before generating an app install package, try the app in Dynamic mode using our Tap Manager app to run your user interface on your mobile phone:
Create the Links
First, associate Tap Manager as the Default Application for your electronic system and create a link to the HMI definition file. When you connect to a Tap (TapNLink, Tapioca, TapNPass, etc.) from the UI Editor, a warning is indicated by this icon:

Click on this icon to get the popup with the list of the current recommendations:
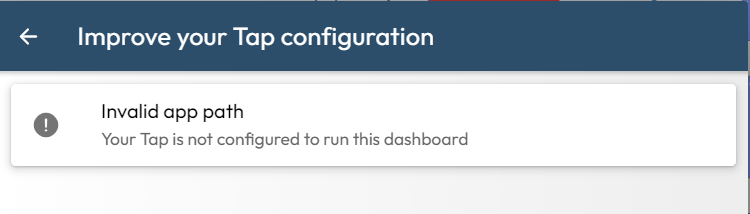
The message above indicates that the link to the dynamic HMI on the server needs to be updated. Click on the message Invalid app path to update the link.
Now, when you bring your NFC phone close to the antenna, Tap Manager will be automatically launched and it will retrieve the HMI description file from a server (here the IoTize server for Tap Manager).
If you want to consult it remotely, you can communicate in BLE, WiFi-socket or MQTT as with any app that is generated by IoTize.
Running Your HMI with Tap Manager
Disconnect your Tap from the Dashboard Creator, then approach your mobile to the NFC antenna of your Tap. Tap Manager is automatically opened, the HMI contents are downloaded, and you can test the HMI on your mobile in dynamic mode.
To Go Further
Plugins
The Dashboard Creator has no real limit in that it is possible to add your own plugins that are written in HTML and JavaScript. For example, a purely graphical plugin allows you to add a weekly scheduler which is very convenient when it comes to configuring a heating system:
More Documentation
Use the links below to learn more about the Dashboard Creator tools:
-
Getting Started tutorial to discover these tools by yourself then create your own project,
-
Various samples to understand how to use some specific components.