Manuals/App Creator/Data Flow Editor
IoT App Creator: Data Flow Editor
Preliminary
The Data Flow Editor is a part of the IoT App Creator and is used as an optional complement of the Dashboard Editor. Using the Data Flow Editor is not mandatory for creating an HMI. However, it is required for advanced features such as applying mathematical conversions to a data flow (ex. a temperature conversion), displaying 2 or more data flow in the same chart, comparing data flows and changing the display based on the comparison. These are just a few examples of how you can use the Data Flow Editor to enrich your HMI.
The general principles
The data flow is composed of nodes and links between the nodes. The links have at one end a transmitter placed on the right side of a node, and at the other end a receiver placed on the left side of other nodes.
Communication along these links is best viewed as propagation of events (or signals) rather than real data flows. Indeed, we speak about data flow, but it would be more appropriate to speak of a network of signals, each signal being able to carry a value or an object. Signals will generally be emitted during a change in value, precisely to signify to the receiving nodes that their input values have been modified.
From the programming point of view, a node will be associated with generated code in the final mobile app. You can consider that at the end, a node corresponds to a function that will be called by the parent transmitters. This node will also call the children receivers to propagate the signal.
Description Nodes
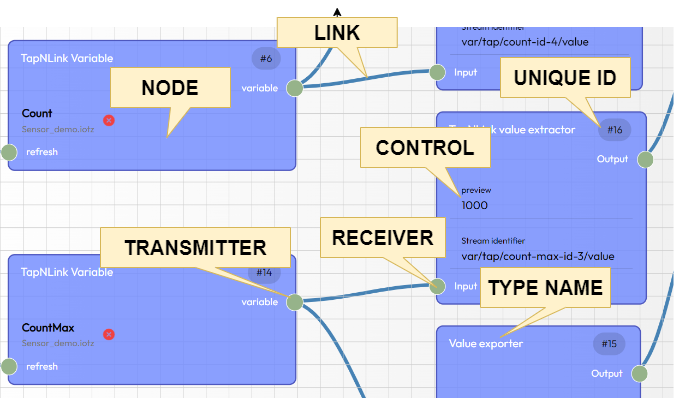
The node above contains the following elements:
| Element | Description |
|---|---|
| Type Name | Type of node |
| Receiver Connections | Green circles. They attach a link. On a mouseover, a tooltip shows the types of the possible link. A white border around the green indicates that the node is selected. |
| Controls | Underlined fields. Here a control is defined by a constant value (right) instead of connecting a link. |
| Node ID | Number in the upper right corner of a node. |
| Transmitter Connections | Generated signal. This can be the result of the operation for an arithmetic node. |
There are different types of controls. Some are simple labels, others can open a text editor (ex. the SVG node). Often, some receiver connections allow you to replace the incoming link with simple constant value.
Adding Nodes
Adding a node can be done:
-
Automatically from the Dashboard Editor when you add a GUI component which is linked to a TapNLink Variable. Connected nodes are automatically added for the GUI Component, TapNLink Variable and a Value Exporter.
-
Manually inside the Data Flow Editor. To do this right-click in the white space to get the contextual menu and the list of the available nodes.
Linking Nodes
Most of the links between nodes will be added automatically. However, you will have to create links if you decide to introduce some specific nodes. The links propagate a signal from node to node. They also carry an object that can be:
- a value (integer or real number),
- a string,
- a boolean,
- a variable,
- an object (array, JSON, etc.)
Some nodes accept any type in entry. Some others accept a combination of the types among those listed above.
When you pass the mouse over a connector, the accepted types are displayed:
If you have to specify a constant value, it is generally possible to enter the value directly in the node. When it is not possible, you can create externally a constant node (section Global => Constant) and link this node with the receiver connector.
Adding a link
To create a link, you need to left click and hold on the transmitter connector to select it, then to move the mouse to a receiver connector and release the mouse button to connect it:
Removing a link
You can suppress a link by left clicking and holding on the receiver connector (mouse left click), then move the link out of the node. The link is suppressed when you release the button:
Viewing node contents
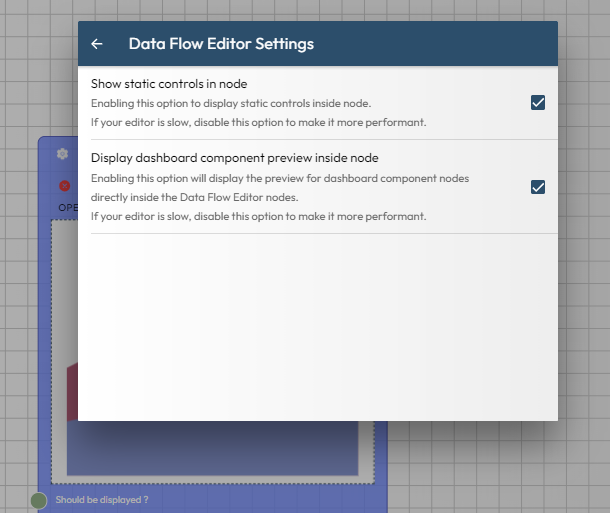
It is possible to display more or less information inside a 'node box'? Two options are available by clicking on the 'settings' icon, at the upper-right corner of the editor:
-
Show static controls in node: this option makes certain node options appear/disappear. When they are absent, you still access to this information by clicking on the 'settings' icon in the upper left corner.
-
Display dashboard component: this option creates the rendering of graphic components inside the GUI nodes. When the option is disabled, you still can see the rendering by clicking on the Preview button.
These options, when enabled, slow down the overall operation of the flow editor. This is not very noticeable as long as the flow has a modest dimension, but for a complex design, the slowdown becomes really annoying. You should then deactivate them (start first with the rendering of dashboard components).
How a Node Works
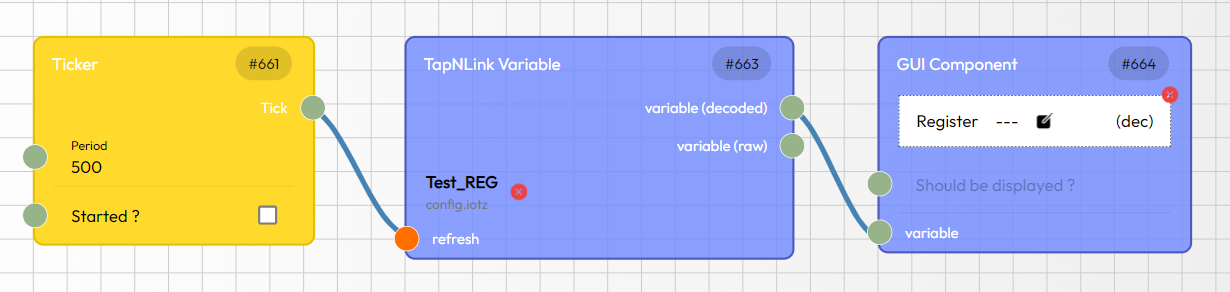
A flow tree reflects the algorithmic operation of the mobile app in which each node corresponds to a subroutine. The initial function (main) is generally a ticker which will launch the execution periodically. It is generally placed on the left side of the diagram. The transmitter connectors then represent calls to subroutines. For example, connecting the ticker to the Refresh receiver of a TapNLink Variable node will trigger the reading of the associated variable. Once the content of this variable has been retrieved, it is exported via the node's transmitters to the graphical component. Typically, this results in the following pattern:
💡 Note:
-
The leftmost node is usually an event generator to signify that we are connected (or disconnected). These nodes make it possible to distinguish the different states of connectivity and to adapt the HMIs accordingly.
-
You can set multiple tickers, with different time periods, to handle different groups of nodes. Ticker events can also be ANDed to temporarily enable/disable their effects.
Single transmitter, multiple outputs
A transmitter connector can be connected to several receiver connectors. It is typically the case for a ticker node. In this case, all the receivers will be called sequentially, but there is no way to define the order of the calls. Note that having several tickers makes sense if you need to define different frequencies.
Single receiver, multiple inputs
It is also possible to connect several transmitters to a single receiver. In this case, the method associated with the receiver can be called by any of the connected transmitter. Therefore, for a node associated with a display, only the very last call is visible.
💡 Note:
The above message changes because the frequencies specified in the tickers are different (300ms vs 500ms).
Special receiver connectors
Some nodes have a red trigger receiver connector:
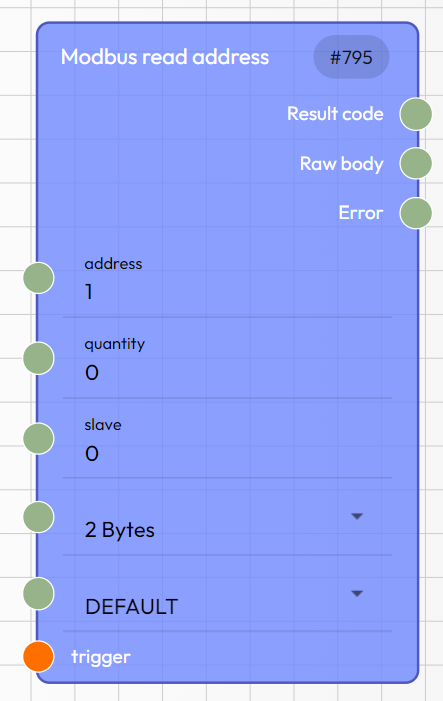
When a trigger receiver connector (red) is present:
-
a change on the other receivers will NOT launch the execution of the method associated to the node. However, the new values will be buffered.
-
the method will be executed ONLY on a change on the trigger receiver.
In the example above, the modbus read address will be executed only when the trigger input changes (not on address/slave/... change).
💡 Notes:
-
Most receiver connectors have a default value. This default is used when there is no inbound link. But when the default does not exist (for example in the case of the inline nodes), you MUST connect a link: if the link is missing, the node will never run.
-
If the incoming link comes from a triggered node, no data is available until the node is triggered.
Different types of transmitter connectors
When a node is executed, all the transmitter connectors are updated. However, some transmitters could stay inactive. For example, this is the case for the error transmitter that is modified only when an error is detected. But for some other nodes, the error transmitter could also send a null signal (e.g. no error...).
Data FLow Editor Commands
There are two set of commands: mouse actions on the drawing, or clicking the buttons in the upper right corner.
On the drawing:
| Action (Windows) | Action (Android) | Command |
|---|---|---|
| Mouse wheel | Pinch | Zoom in/out |
| Left click on nodes | Tap a node | Select a node |
| Left click on connectors | Tap a connector | Create/Modify a link |
| Left click on controls | Tap a control | Edit the control |
| Left click+drag | Tap and drag | Move the flow |
| Right click | Tap and Hold | Pop up menu for the selected node |
With the right corner buttons:
| Action | Command |
|---|---|
| Add variable | Add a variable from a resource file |
| Default view (Show All) | Panorama view |
| Grid alignment | To align the nodes on the grid |
| Clear All | Reset the current project (delete all nodes) |
| Undo / Redo | Undo / Redo the last changes |
| Save | Save the current project on the server |
| Run/Stop | Launch the dynamic execution (communication) |
| Help | Opens help |
Different types of nodes
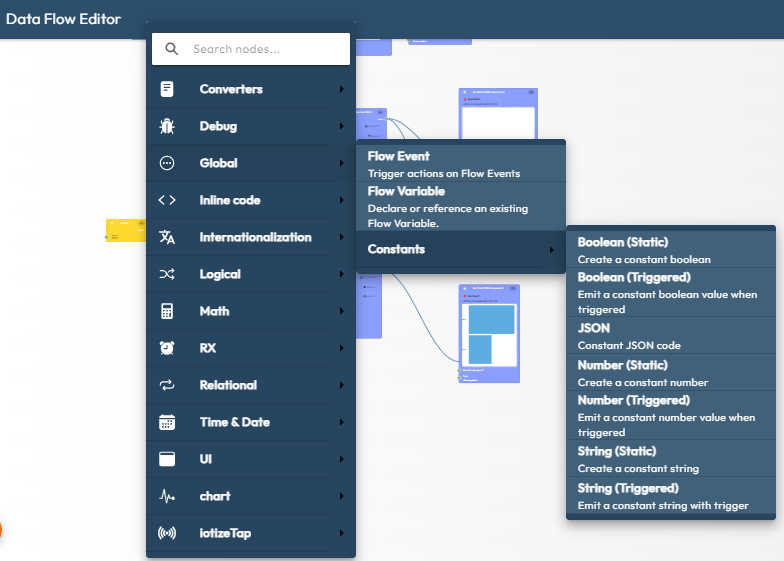
You will find in the popup list of the available nodes several categories:
| Type | Description |
|---|---|
| Chart | Data formatting for charts |
| Converter | Various types of conversion |
| Debug | Debug nodes in the editor |
| Global | Constant and global variables |
| Inline code | Specific operations |
| Logical | Boolean operations (AND, OR,..) |
| Math | Simple operations (add,...) + Trigo and Crypto |
| Rx | Rx components (delay, ...) |
| Relational | Various binary comparisons |
| Time&Date | Time formatting |
| UI | User interface components |
| Raw Wireless | Generic wireless nodes (NFC,BLE) |
| IoTizeTap | Hardware interface |
Converter nodes
Many different types of conversion are possible. Converter nodes are used, for example, to display an hexadecimal addresses, or to extract a value from a JSON object.
💡 Note:
If you don't find the converter nodes you are looking for, a simple workaround is to create a unary inline code node and to edit your own converter in Java script.
Access object property
This node allows to extract a sub-element from an object (for example from a JSON file) identified by its key (the property).
For example let's consider the node below:
{
    "glossary": {
        "title": "example glossary",
    }
}
if this object is connected to a node Access object property with "glossary" as property the propagated output will be:
    {
        "title": "example glossary"
    }
The extraction applied to the first level only. If you want to extract a deep element (e.g. 'param.background.color'), you have to chain multiple converter nodes. An alternative consists in editing a single Unary Inline node that returns the desired level:
return input.member_lvl1.member_lvl2.member_lvl3;
Chain converters
This node makes it possible to chain several converters. For example, you can convert a 32-bit integer to a buffer, then swap the bytes of the buffer (changing the byte order), then convert the resulting buffer to a float.
Decimal
This node allows to round a floating point value.
Debug
They don't have any impact on the generated code, nor on the Dashboard. They are useful in Preview mode to display the values of intermediate connections when the expected result does not appear on the leaf GUI component.
Logger
The logger sends messages to the console of your browser when running the app in Preview mode.
Example: The two connected nodes below:
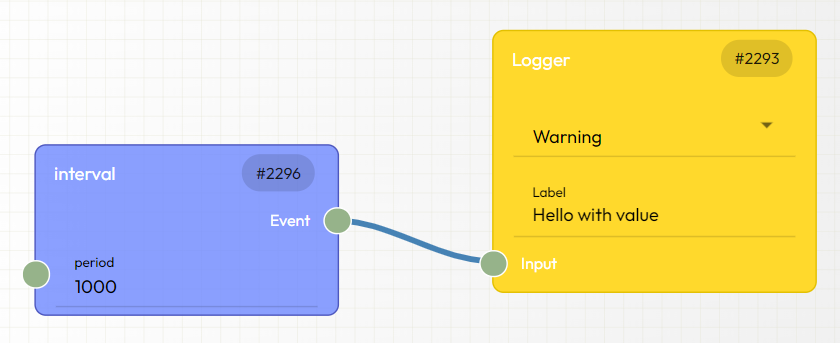
send theses messages to the console of your browser:
DefaultLoggerWorkerService [warn][Hello with value] 0
DefaultLoggerWorkerService [warn][Hello with value] 1
DefaultLoggerWorkerService [warn][Hello with value] 2
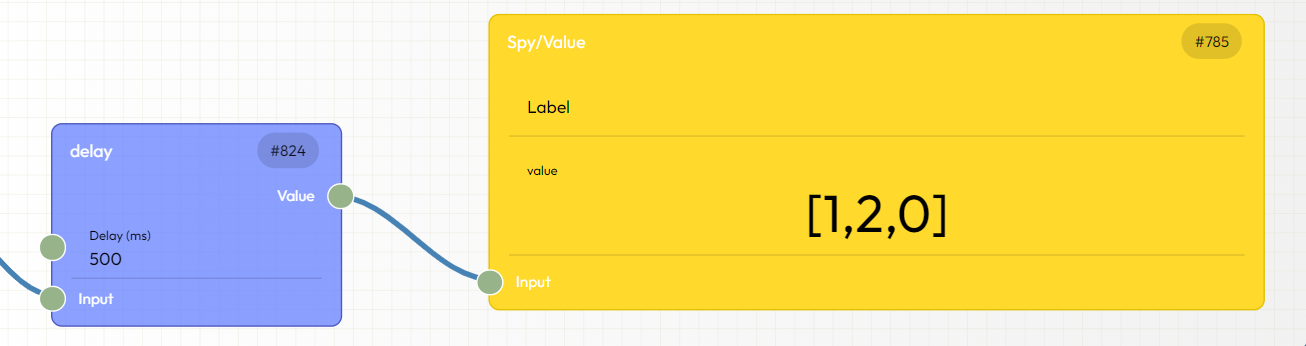
Spy/debug
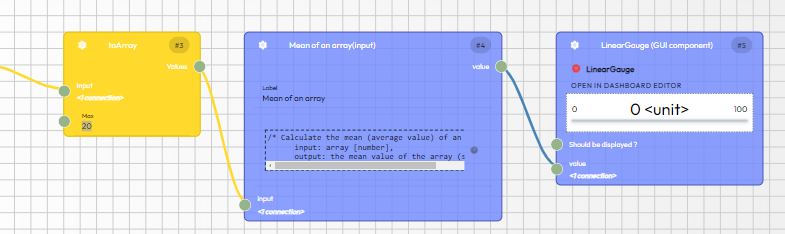
This node displays the value carried by the input signal.
Example: In the example below, the input signal carries an array.
Global
Constants: string and number
These nodes provide a simple way to define constant values of strings or numbers.
Constants: JSON
A constant JSON node is also editable. For example, this node allows you to define a constant array such as to initalize the list of the months, the days of the week, etc.
Constants: static and triggered nodes
A static node will propagate its value only at initialization. Then the value will be available, but no more events will be generated.
A triggered node has a trigger connector as input. The output will be propagated everytime the trigger signal is received.
For example if two triggered constant nodes are connected to the same input, a new triggering will generate an event for the common receiver connector. The current received value will match with the last triggering.
Flow event
The Start and Stop event are global event generated when we enter/leave the application. They can be used as triggers to initialize/reset some values.
Flow variable
The concept of flow variable is very important: it allows to create bridges between the Dashboard editor and the Dataflow editor. It also allows to create multiple instances of a signal without multiplying the links (wires) on the diagram.
For example, in the figure below, we see two equivalent ways to send the output signal of the node SRC to the nodes DestN: either the links consist in 4 wires, or the output is sent to a 'flow variable' named Var_XXX, and the multiple instances of Var_XXX allow to propagate the signal to the DestN nodes. This is convenient when the flow diagram is complex and the DestN are far from each other.
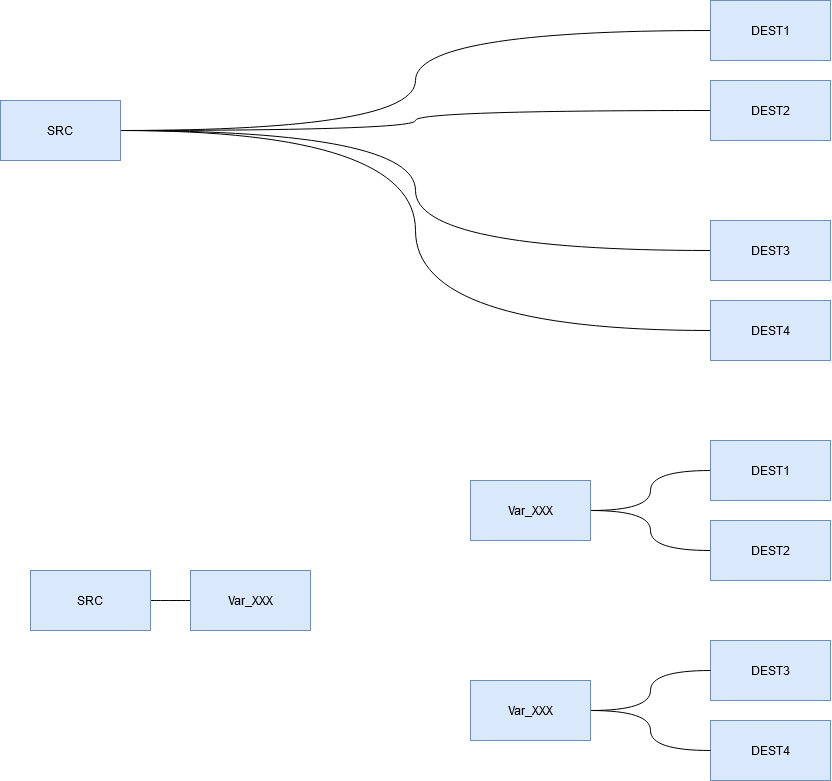
But the main use of the flow variables consist on creating bridges between the dashboard and the dataflow: they can be imported in most of the settings of dashboard components. By this way, a colour or a title can be easily driven by the dataflow. The Hide/Show control available in the Structural section (Should be displayed?) can also be controlled by a flow variable. Note that several flow variables could be connected to a single parameter (in the graph). In this case, the last generated event will be considered as being the active input.
💡 Note:
Flow variables provide bridges between the dashboard and the dataflow Editors. We consider them as global because they can be inserted as new nodes anywhere in the graph. But their values cannot be used directly in a JS code. Additonally, when such a flow variable changes, a signal propagates (and this action could be undesirable). If you need to store and keep a 'variable' in global application scope, you should use the window.variablename syntax instead. 'window.variablename' will be stored in the App and will be available in all the inline nodes.
Internationalization
The Translate node takes as entry an id of the multilingual dictionary, and as output the corresponding text that depends on the active language. Note that this node has to be triggered (at least once) to output a valid string.
See the multilingual example in the 'SAMPLES' section
Inline Code
Inline-code makes it possible to pass from 'No Code' to 'Low Code'. Above all, it allows you to edit specific functions, those specific to your business, which have not been provided for in the tool.
As with math nodes, inline nodes accept either one or two inputs and provide one output. They can describe any kind of expression written in JavaScript. The particularity of these nodes is that they are editable.
The inline-code section provides two blank nodes to edit and some examples of useful implementations classified into two categories:
-
Simple expressions on values: conversion from °C to °F or the formatting of a timestamp,
-
Expressions applicable to arrays: average of array elements, array rotation, ….
Each inline node is also associated with a label in order to maintain a simple identification.
💡Important notes:
-
Faulty inline code could generate errors, either when building or at runtime. If you get some errors messages when building, check first your inline codes.
-
The inline code will be considered JavaScript in dynamic mode and as TypeScript by App Generator (to create the static application). Since the inline code is supposed to be quite short, you should have no problems. However, some minor differences could cause errors:
-
TypeScript is less tolerant than JavaScript. For example, no error will be generated for JavaScript when a variable (var) is declared twice in an inline node. But an error will appear in the generation of applications when building as TypeScript.
-
JavaScript offers more flexibility for types than Typescript. Theoretically, errors could occur at runtime in TypeScript when the types do not match. But if the code works correctly in dynamic mode, there is no reason to encounter such an error in static mode.
Logical
These perform operations with boolean values (AND, OR, XOR,...). The input types are not only boolean but any type accepted by JavaScript for these operators.
Math
This category offers a large set of simple nodes which perform elementary operations. Note that if you need to edit a complex mathematic expression, it would be more efficient to insert the formula within an unique Inline Code node.
Arithmetic
The basic arithmetic operators: +, -, *, ... Both the input and the output type must be number.
Bitwise
Bitwise operators are often useful in embedded systems. They allow extraction of bits from words by applying masks. The type of the output is number.
Trigo/log/...
Various mathematic functions are provided. Note that any expression can be easily constructed using the unary-type node.
Crypto
For encryption, two generic nodes to Encrypt/Decrypt are available. Then you must specify the type of Encryption you wish to apply among AES-CTR, AES-ECB, AES-CBC, AES-GCM, AES-CFB, AES-OFB, DES and 3DES (triple DES).
The key and the input data have to be formatted as buffer (array of unsigned char).
Then, you can specify the options you prefer (for example the Initialization Vector) by providing the information (as JSON) to the options connector. The list of the options depends on the selected encryption mode:
| Mode | Link to the description of the parameters |
|---|---|
| AES-CTR | AesCtrParams for SubtleCrypto |
| AES-CBC | AesCbcParams for SubtleCrypto |
| AES-GCM | AesGcmParams for SubtleCrypto |
and for the other modes (AES-ECB, AES-CFB, AES-OFB, DES and 3DES) the cryptoJS library is used. For these, two optional parameters can be specified: initialisation vector and padding method. They must be formatted as below:
{
    iv?: Uint8Array,
    pad?: PaddingMode
}
With:
type PaddingMode = 'Pkcs7' | 'Iso97971' | 'AnsiX923' | 'Iso10126' | 'ZeroPadding' | 'NoPadding';
For Hascoding, the SHA-1, SHA-256, SHA-384 and SHA-512 methods are available.
See also the Cryptography example in the 'SAMPLES' section
Rx
RxJS is a useful library but only a few functions are available here.
debounceTime
Discards emitted values that take less than the specified time between output.
💡 This operator is popular in scenarios such as type-ahead where the rate of user input must be controlled!
toArray
This is not the original implementation. This node allows the accumulatation the input values within an array but it limits the overall size (in a FIFO mode).
💡 It can be used, for example in combination with the node mean for arrays to build a simple moving average filter. The schema below removes the noise for temperature values by calculating the mean of the last 20 values:
interval
This node generates periodic signals associated with an incremented value.
delay
This node forwards the input signal after the specified delay.
timer
This node combines the two previous nodes and generates a periodic series of numbers after a delay. The total number of events can be also specified.
distinct
This node propagates the input only when its value is modified.
debounce time
Discard all glitches (changes of values with a duration lesser than the specified delay).
filter truthy/falsy
This node detects whether the input can be considered as true or false. Falsy means 'false' for a boolean, '0' or 'NaN' for a number, 'undefined' or 'null' for an object, or empty ('') for a string.
Relational
These nodes provide the relational operators (<, >, ==, >=, ...). The Comparator node groups the 3 main operators: >, <, == in a single node. The output type is boolean.
Time&Date
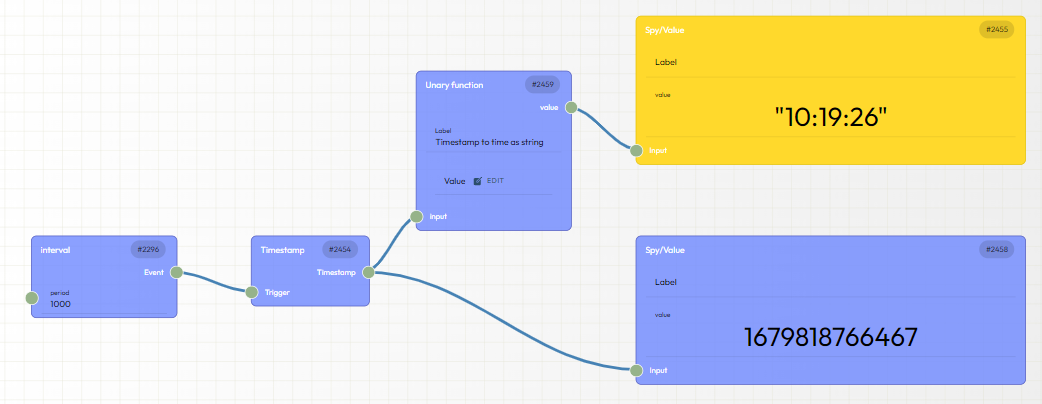
The node Timestamp provides the current time (UTC) in ms since 1/01/1970. Time is generally stored as timestamp in Duetware.
The diagram below shows how to display the current time:
A Ticker node behaves as a global clock to trigger one or several nodes. Typically, hardware connected nodes need to be triggered to read periodically a value from a sensor and update it.
💡 Note:
-
Tickers are characterized by their period in ms. Do not use high frequency tickers: they would saturate the overall dynamics of the App. Reading a Tap variable once or twice every second is reasonable, but 10 times per second will generate collisions.
-
Adapt the periods of your tickers to the type of variables. Just read a 'static' variable every 2 or 5 seconds.
-
A ticker can be enabled/disabled. Use this feature to stop read actions when your module is not connected (it would generate timeout errors);
UI
UI groups the nodes that establish the interface in the dashboard. Once inserted in the graph, you can select the right component from the ones already placed in the dashboard.
Event
An event catcher will capture a possible event generated by the graph, then it's output can be used to trigger different actions.
GUI component
The GUI elements that are already defined in the dashboard are selectable. An Exporter node will be automatically added to the data flow for these when selected.
The settings of the GUI component must be defined from the Dashboard Editor.
Toast
A toast is a popup message that appears on the bottom of the screen for a couple of seconds (the duration can be specified).
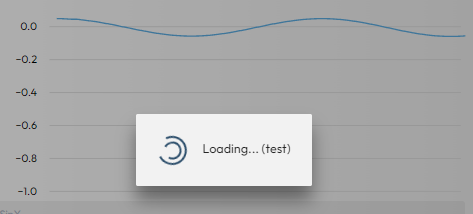
Show/Hide loader
The Show loader node will popup a window with a 'rolling icon' and a message. This popup window can be closed by triggering the Hide loader node.
Exporting data to the dashboard editor
When a GUI node is present on the dataflow, you can select which inputs will be available from the dataflow (click on the settings icon at the top left corner of the node). You can then link an output to the GUI input, but only when the types are identical or compatible.
From the dashboard editor, it is also possible to connect the output of a node, but you will have to create a 'flow variable' as intermediate node. Indeed, only the flow variables are selectable from the dashboard editor.
Chart
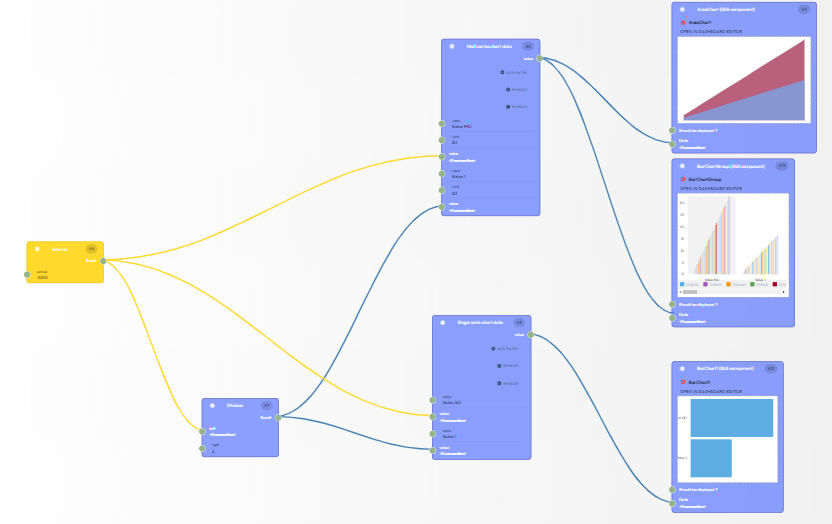
There are two types of tabulators to prepare the entries to a chart: Multi-series and Single-series Each of these tabulators must be used depending on the type of graphic chart component.
-
Multi-series formats the data for a dynamic view (a 'movie') where the time appears.
-
Single-series formats the data with a list of positions. For example, if we define 5 entries for a bar graph, each bar will display one of the entries. A single serie node can be redirected to a multi serie input.
We see below that we need a dynamic collector for a chart that represent the time on the Y axis. The last bar graph shows two single values (the instant ones).
Both implementations support multiple entries to feed charts with multiple combined data.
See the Simple Chart example in the 'SAMPLES' section
IoTize Tap
These components interface directly with the Tap hardware. They manage the different cases of communication errors.
Login / Logout / Login Dialog
Login and Logout will perform standard login actions. The result of the action is available as output (Successful/Error/..).
Login dialog will open a standard dialog box. Passwords would be then managed by the OS (and potentially saved with the user's passwords in the mobile/computer).
Tap Auth State
This node provides the information about the login status: id of the profileId, UserId, ... are available in a generic object. It is possible to extract this information (with a JSON extractor) in order to check the rights of the current user.
Tap Connection State
This node provides the information about the connection status. It can be easily used to enabled/disabled actions that require a valid connection.
Tap resource value
Execute a GET lwM2M command. An error will be generated when the current user is not authorized to execute the specified request.
Raw Wireless
These generic nodes provide access to embedded systems via mobile wireless communication channels: NFC, BLE, etc. They are completely independent of the Duetware firmware and/or Iotize modules.
💡 Note:
For now, the 'Raw wireless' features are available on Android and iOS exclusively (and not on Web-App). This also means that tests must be carried out from mobiles based on these systems (either in dynamic mode on Tap Manager, or on the generated Apps).
NFC
See the example available in the 'SAMPLES' section
NFC nodes are of two types: generic nodes and nodes dedicated to the ST25-DV which implements proprietary commands in ISO-15693 (NFC type V). The ST25-DV nodes were added to simplify the management of the communication buffer of this component which would have had to be broken down into numerous generic nodes.
| NFC Node | Description |
|---|---|
| Tag discovered | This node triggers an event when an NFC Tag is approached. At the output, the information in JSON format includes general data concerning the Tag. This node needs to be activated (for example by launching the application: Global event/Start Engine). Events are also available to check the result of the initialization. |
| Begin session | This node must be triggered for iOS to start a NFC session. |
| Close session | This node must be triggered for iOS to close the current NFC session. |
| NDEF parse | This node will format properly the tag.ndefMessage extracted from the output of NFC Tag discovered |
| Transceive | This node allows you to send a data packet and obtain the associated response. |
If the PICC target embeds a ST25-DV, we recommend using the following nodes once the communication (instead of NFC transceive) to communicate:
| ST25DV Node | Description |
|---|---|
| FTM Read | Write a data packet to the mailbox |
| FTM Write | Read a data packet from the mailbox |
| FTM Write with Response | Combine the two previous nodes with timeout definition |
| Write dynamic register | Read one of the dynamic registers accessible from the RF side |
| Write dynamic register | Write one of the dynamic registers accessible from the RF side |
💡 Note: We recommend to explore the graph of the Raw NFC example to understand how to use these nodes.
BLE
See the example available in the 'SAMPLES' section. This example shows how to scan the available Iotize devices, then connect to the specified device, then send 3 basic lwM2M commands. The Iotize services use the notification method.
The generic nodes below are available:
| BLE Node | Description |
|---|---|
| Start Scan | The scanner is launched. See below for the filter definition. |
| Stop Scan | The scanner is stopped. |
| Connect to device | Connect the specified device (by its address) |
| Disconnect from device | Disconnect the specified device (by its address) |
| Discover services | Get the list of the available services on the connected device |
| Start Notification | Start notification mode for a specific characteristic |
| Stop Notification | Stop notification mode for a specific characteristic |
| Listen characteristic | In notification mode, get the notified buffer on change |
| Write Characteristic | Write a buffer (uint8array) on a specific characteristic |
| Read Characteristic | Read into a buffer (uint8array) from a specific characteristic |
💡 Notes about the Scan process:
Scan may vary slightly depending on operating system. For example:
-
on a WebApp (Chrome), Scan is completely managed by the browser and there are some restrictions regarding filtering. La sélection et la connexion sont gérés par le browser qui réunit donc les noeuds Scan et Connect en une seule opération.
-
on iOS, the information returned by the Scan process does not contain the MAC address of the device, but a built UID.
but these differences does not change really the dataflow graph.
When starting the Scan process, filters can be specified for both services and manufacturer data.
The format of the Services filter must be as follows:
[ string ]
Example (to filter the TapNLink devices by their services):
[
        "7c7b16c2-2a5b-8c9f-cf42-d31425470e7b",
        "6c7b16c2-2a5b-8c9f-cf42-d31425470e7b"
]
The definition of the filters appears when placing the cursor over the input connector:
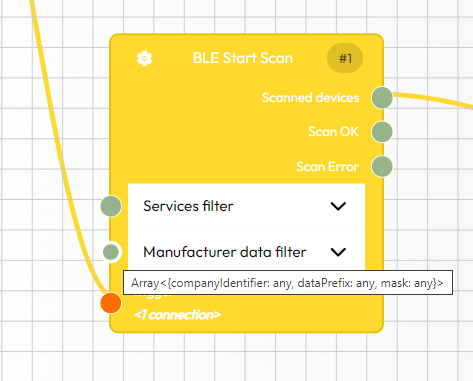
In this case we could specify as a filter on ‘Manufacturer Data’ a JSON file which contains:
[ {companyIdentifier: 0x004C} ]
to list the devices from Apple. The complete definition for an element of the Manufacturer Data array is as follows:
{
  companyIdentifier?: number | Uint8Array | number[];
  dataPrefix?: Uint8Array | number[];
  mask?: Uint8Array | number[];
}
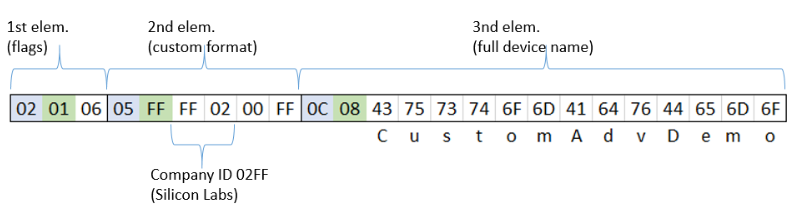
All these elements are optional. Only the companyIdentifier can be a single number value. dataPrefix and mask allow to filter the custom data in the third element of the manufacturer data:
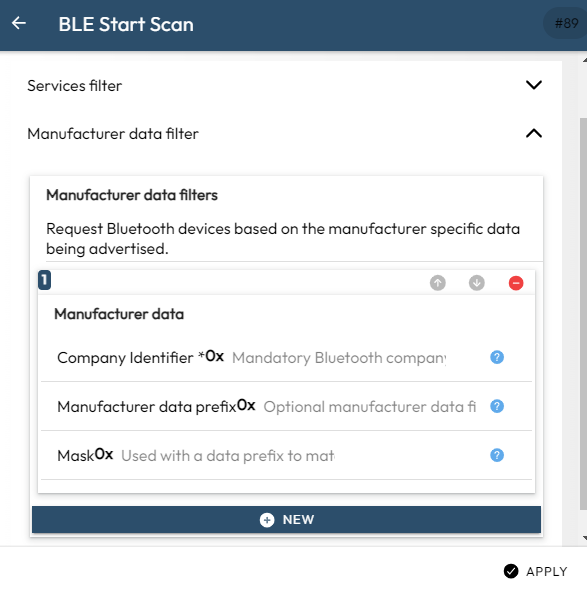
Note that you can either build the filter information outside (external node), or by clicking on the internal settings. In this case, you will have an helper to enter the data:
💡 Notes about accessing to characteristics:
-
At the moment, only ONE device can be connected (even if the OS would accept multiple connections).
-
Some characteristics may be locked for reading or writing.
-
To read data from a BLE characteristic, the Read and Notification methods are possible. The choice generally depends on the implementation of the service. For example, only Notification works with IoTize BLE services.
-
To specify a device, it is possible to send either the Device Name or the Device Address obtained from the Scan node information. In the case of Android, the address field is the MAC address of the device, but with iOS it will be a constructed UID.
Issues with the Dataflow Editor
Working on the data flow could generate some problems. For example, inline code nodes could contain some errors that will be detected only when executing the code. When a node generates an error, it is generally easy to locate it in the graph (its header turns red). If you click on the header, some error information will be displayed.
Debugging inside the Dataflow
There are two types of nodes dedicated to debugging: spy and logger. These nodes allow the output of intermediate values in the flow. We recommend using loggers which can be traced in messages sent to your browser console. Graphical components (e.g. the Toast component) can also be easily used for debugging purposes.
Debugging with your browser
In case of errors in your code, it is possible to determine the source by opening the internal debugger environment of the browser (generally 'Shift F12'). See the documentation of your browser.